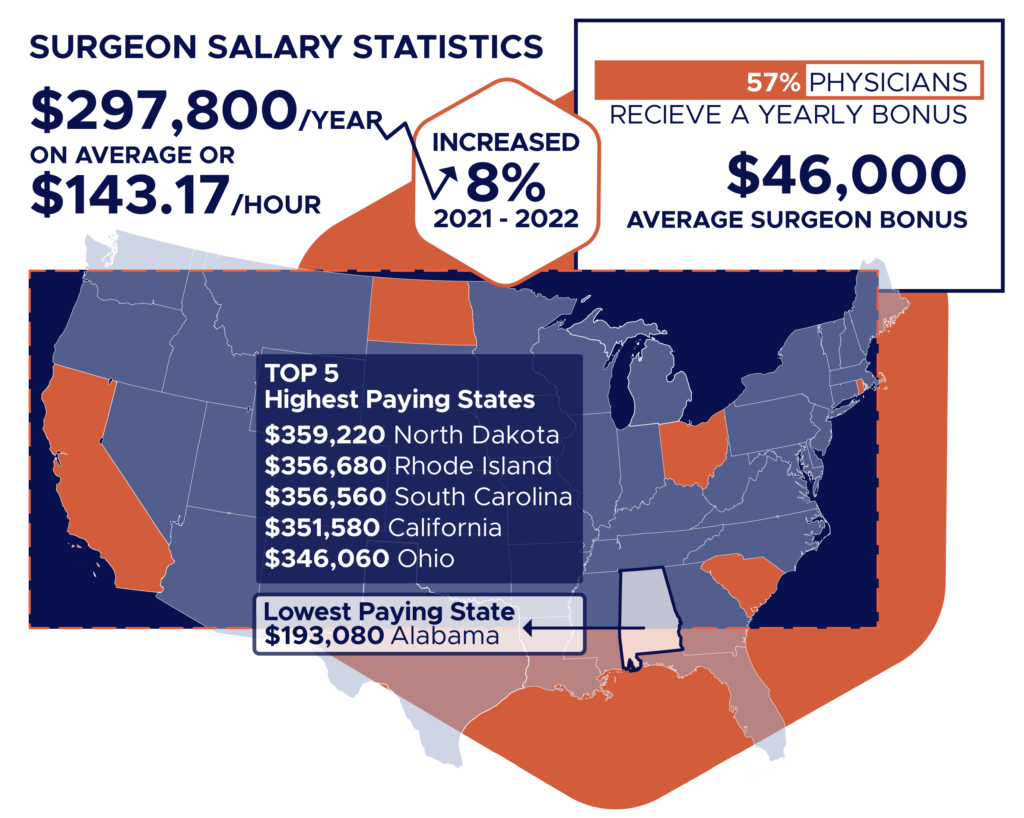
- According to the U.S. Bureau of Labor Statistics, the mean annual wage for surgeons is $297,800.
- According to Medscape, general surgeons earn an average of $402,000 annually.
- North Dakota is the highest paid state in the U.S. for surgeons with a mean annual salary of $359,220, according to the U.S. Bureau of Labor Statistics.
According to the Association of American Medical Colleges, there were 24,880 active general surgeons in the U.S. in 2021. That number almost triples when you factor in surgery specialties like plastic, orthopedic, vascular and more.
Surgeons have varying salaries based on specialty, location and other factors, but it is a good idea to have a general understanding of salary to help guide negotiations and create a financial plan.
There is varying data available for surgeon salaries, but in this article we will use Medscape’s general surgeon salary data and the U.S. Bureau of Labor Statistics’ “all other surgeons,” which includes all surgical specialties except orthopedic and pediatric surgeons and ophthalmologists.
What is the average surgeon salary?
According to the BLS, the mean annual wage for “all other” surgeons is $297,800.
Medscape reports that general surgeons’ average annual earnings were $402,000 in 2022.
How much do surgeons make per hour?
The mean annual wage for surgeons as reported by the BLS equates to an hourly wage of $143.17.
Surgeon salary by state: What do physicians make in each state?
Surgeons’ salaries can vary greatly by state and territory, ranging from $193,080 in Alabama to $359,220 in North Dakota. According to the BLS, these are the annual mean salaries for “all other” surgeons by state:
- Alabama – $193,080
- Alaska – $336,900
- Arizona – $327,520
- Arkansas – $326,440
- California – $351,580
- Colorado – $294,500
- Connecticut – $242,330
- Delaware – N/A
- District of Columbia — $289,860
- Florida – N/A
- Georgia – $330,860
- Hawaii – $302,040
- Idaho – $320,740
- Illinois – N/A
- Indiana – $268,820
- Iowa – $289,990
- Kansas – $266,510
- Kentucky – $332,610
- Louisiana – $345,000
- Maine – N/A
- Maryland – $317,220
- Massachusetts – $345,710
- Michigan – $300,200
- Minnesota – N/A
- Mississippi – $329,820
- Missouri – $337,390
- Montana – $339,520
- Nebraska – $320,570
- Nevada – $335,250
- New Hampshire – N/A
- New Jersey – N/A
- New Mexico – $339,130
- New York – $249,450
- North Carolina – N/A
- North Dakota – $359,220
- Ohio – $346,060
- Oklahoma – $317,160
- Oregon – $330,200
- Pennsylvania – $268,930
- Rhode Island – $356,680
- South Carolina – $356,560
- South Dakota – N/A
- Tennessee – $273,720
- Texas – $279,600
- Utah – $303,360
- Vermont – $260,210
- Virginia – $262,210
- Washington – $304,910
- West Virginia – $328,310
- Wisconsin – N/A
- Wyoming – N/A
Highest paying states for surgeons
According to the BLS, these are the highest paying states for “all other” surgeons:
- North Dakota – $359,220
- Rhode Island – $356,680
- South Carolina – $356,560
- California – $351,580
- Ohio – $346,060
Physician salary by specialty: How do surgeons’ salaries compare to other specialties?
According to Medscape, general surgeons make an average of $402,000 per year. The average salaries for other medical specialties are as follows:
- Plastic surgery – $576,000
- Orthopedics – $557,000
- Cardiology – $490,000
- Otolaryngology – $469,000
- Urology – $461,000
- Gastroenterology – $453,000
- Dermatology – $438,000
- Radiology – $437,000
- Ophthalmology – $417,000
- Oncology – $411,000
- Anesthesiology – $405,000
- Emergency medicine – $373,000
- Critical care – $369,000
- Pulmonary medicine – $353,000
- Ob/Gyn – $336,000
- Pathology – $334,000
- Nephrology – $329,000
- Physical medicine & rehabilitation – $322,000
- Neurology – $301,000
- Allergy & immunology – $298,000
- Rheumatology – $289,000
- Psychiatry – $287,000
- Internal medicine – $264,000
- Infectious diseases – $260,000
- Diabetes & endocrinology – $257,000
- Family medicine – $255,000
- Pediatrics – $244,000
- Public health & preventive medicine – $243,000
How do surgeons’ bonuses compare to other bonuses?
According to data from Medscape, 57% of physicians receive an incentive bonus as part of their income. The average annual bonus for a general surgeon is $46,000.
Other specialties’ average incentive bonuses are
- Orthopedics – $126,000
- Ophthalmology – $100,000
- Cardiology – $85,000
- Gastroenterology – $74,000
- Urology – $73,000
- Anesthesiology – $68,000
- Radiology – $66,000
- Pathology – $54,000
- Emergency medicine – $51,000
- Ob/Gyn – $49,000
- Physical medicine & rehabilitation – $48,000
- Psychiatry – $33,000
- Family medicine – $30,000
- Internal medicine – $29,000
- Neurology – $29,000
- Pediatrics – $28,000
Are surgeons’ salaries increasing?
According to Medscape, general surgeons’ salaries increased by 8% in 2022, though individuals may have seen their personal income decline.
Before you go…
The salaries of medical professionals, including surgeons, can vary greatly depending on the region and the practice.
The sudden rise in salary that occurs when transitioning from training to practice can be difficult to adjust to. Our Build Your Team program connects you to experts in financial planning, budgeting, taxes, and more for free, so that you can feel confident in negotiating and navigating your new salary.
For more helpful information and tips, visit our Resources page or read one of our featured articles below:
- Considering a Job Change? Here’s What Doctors Should Know
- How Doctors Can Improve Their Credit Score & Other Common Credit Score Questions
- What You Need to Know About Credit Card Consolidation for Doctors
- Personal Loans for Doctors: What You Need to Know
Panacea Financial, a division of Primis. Member FDIC.


