- According to the U.S. Bureau of Labor Statistics, the mean annual wage for dentists was $160,370 as of May 2021.
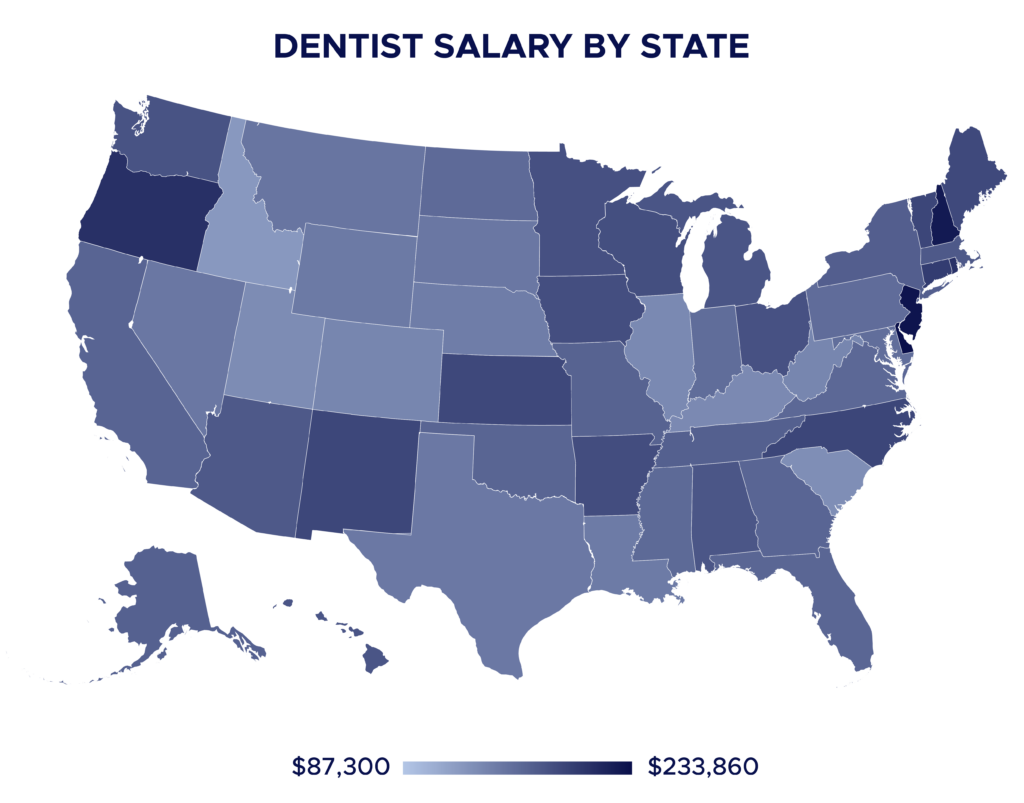
- Delaware is the highest paid state in the U.S. for dentists with a mean annual salary of $233,860.
- With a mean annual salary of $311,460, oral and maxillofacial surgery is the highest paying dental specialty.
Whether just beginning dental school, in training, or already a practicing dentist, having an income expectation can help guide salary negotiations and create a long-term financial plan.
What is the average dentist salary?
The mean annual wage for general dentists was $160,160 as of May 2021, according to the U.S. Bureau of Labor Statistics.
Based on percentile wage estimates from the BLS, the 10th percentile of dentists makes $62,810. The 25th percentile makes $101,570, the 50th makes $160,370, the 75th and 90th makes more than $208,000 per year.
How much do dentists make per hour?
The mean annual wage reported by the BLS equates to an hourly wage of $80.37.

Dentist salary by state: What do dentists make in each state?
Dentists’ salaries can vary greatly by state and territory, ranging from $87,300 in Puerto Rico to $233,860 in Delaware. According to the BLS, these are the annual mean wages based on data from May 2021:
- Alabama – $176,910
- Alaska – $168,390
- Arizona – $175,030
- Arkansas – $184,540
- California – $165,950
- Colorado – $139,460
- Connecticut – $197,910
- Delaware – $233,860
- District of Columbia – $181,410
- Florida – $164,370
- Georgia – $165,160
- Hawaii – $177,820
- Idaho – $124,750
- Illinois – $136,930
- Indiana – $159,240
- Iowa – $183,710
- Kansas – $188,240
- Kentucky – $136,480
- Louisiana – $148,060
- Maine – $187,460
- Maryland – $158,520
- Massachusetts – $175,140
- Michigan – $178,250
- Minnesota – $181,760
- Mississippi – $161,700
- Missouri – $167,240
- Montana – $152,770
- Nebraska – $146,170
- Nevada – $151,130
- New Hampshire – $225,140
- New Jersey – $229,680 (according to DentalPost)
- New Mexico – $189,430
- New York – $170,800
- North Carolina – $189,980
- North Dakota – $161,080
- Ohio – $180,920
- Oklahoma – $165,380
- Oregon – $207,370
- Pennsylvania – $159,450
- Puerto Rico – $87,300
- Rhode Island – $206,600
- South Carolina – $132,830
- South Dakota – $150,630
- Tennessee – $169,610
- Texas – $150,060
- Utah – $134,570
- Vermont – $190,030
- Virginia – $162,750
- Washington – $182,050
- West Virginia – $139,200
- Wisconsin – $183,110
- Wyoming – $148,730

Highest paying states for dentists
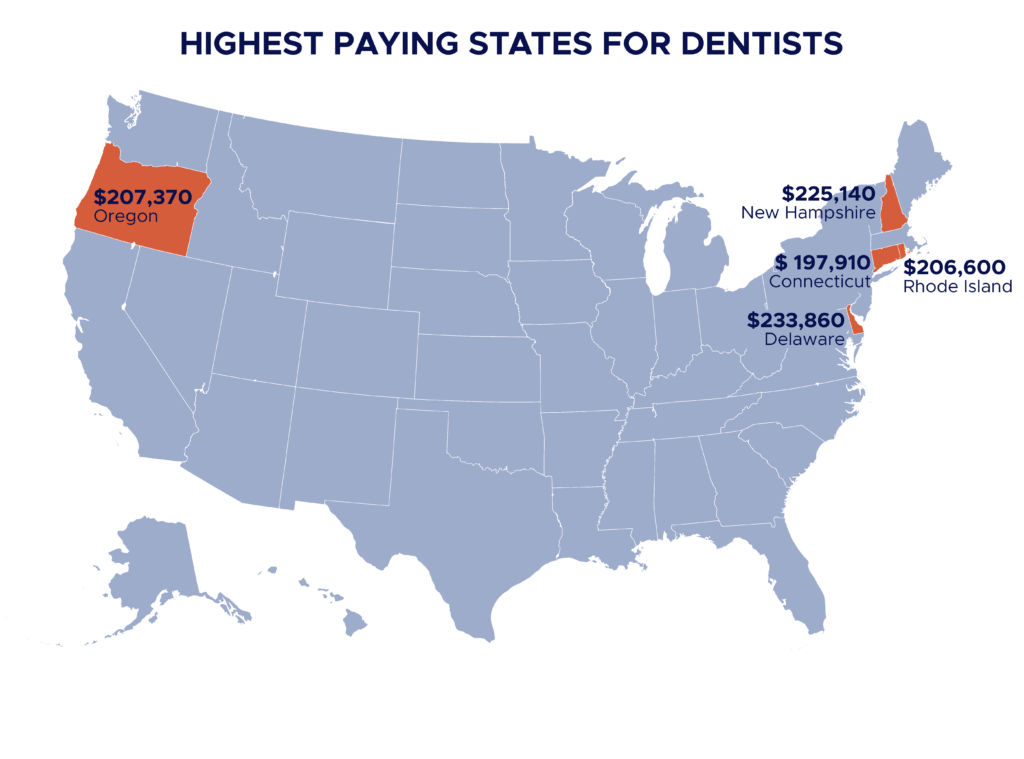
According to the BLS, these are the highest paying states for general dentists:
- Delaware – $233,860
- New Hampshire – $225,140*
- Oregon – $207,370
- Rhode Island – $206,600
- Connecticut – $ 197,910
*New Jersey was not included on this list because it came from a separate data source.
Dentist salary by specialty: What do dental specialists make?
Pursuing a dental specialty can cause an individual to take on more debt and spend more time in training, but it can also lead to a higher paycheck. According to the BLS, the average salaries for dental specialities are as follows:
- Oral and maxillofacial surgeon: $311,460
- Orthodontists: $267,280
- Prosthodontists: $143,730
- Other dental specialists: $179,400
How are dentists paid?
According to DentalPost, more than half (54.5%) of dentists are paid an annual salary. 36.5% of dentists are paid based on percentage of production. 6% are paid daily and 2.5% are paid hourly.
How does dentist salary differ for private and corporate practice dentists?
The type of practice a dentist works at can have an effect on their salary. DentalPost reports that pay for corporate practice dentists can fluctuate significantly over time, while salary for private practice dentists rises consistently over time.
Across all dental practices and experience levels, owners and partners average $100,000 more in annual income than associates. To learn more about the differences in salary and benefits for private and corporate practice dentists, check out this more in-depth article.
How do dental implant procedures affect pay?
According to DentalPost, general dentists who perform dental implant procedures earn more on average than those who do not. Private practice dentists who perform dental implant procedures earn on average $105,000 more per year — an average of $364,946 for those who do, $259,284 for those who do not.
The difference is even greater for dentists at corporate practices. Corporate practice dentists who perform dental implant procedures earn an average of $129,000 more than those who do not. The average income of implant dentists at corporate practices is $315,476. The average income for non-implant, corporate dentists is $186,305.
Before you go…
These salary figures are simply averages from surveys and can differ at different practices in different locations.
For many dentists, it can be difficult to adjust to the large jump in income from training to practice. Having support and resources can help you feel confident as you negotiate and navigate your new salary. If you need help with financial planning, budgeting, taxes, or other areas, we can connect you with industry-specific experts for free. Find out more about our Build Your Team program here.
For more helpful information and tips, visit our Resources page or read one of our featured articles below:
- Corporate vs. Private Practice: Three Differences in Dentist Salary and Benefits
- How Doctors Can Improve Their Credit Score & Other Common Credit Score Questions
- What You Need to Know About Credit Card Consolidation for Doctors
- Personal Loans for Doctors: What You Need to Know
Panacea Financial, a division of Primis. Member FDIC.


